Data Analytics for Small Business: 2026 Guide
Data Analytics for Small Business: From Gut Feeling to Informed Decision-Making
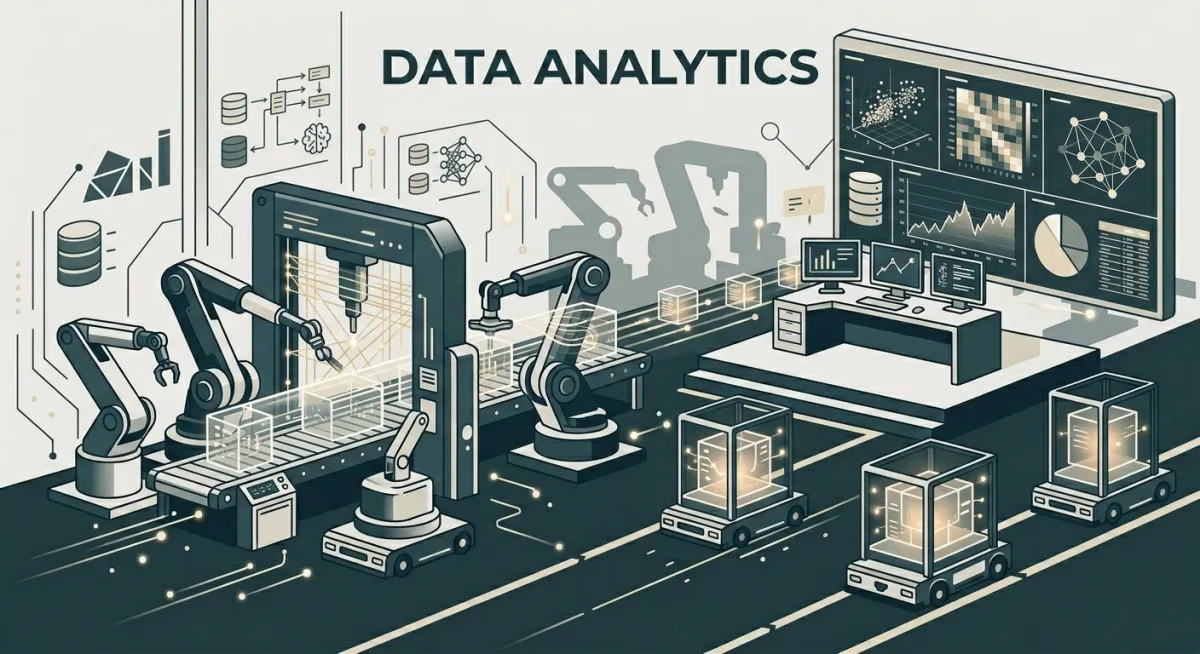
Data analytics for small businesses means collecting, processing, and interpreting operational and customer data to make faster, more accurate decisions—without needing a data science team. In 2026, the barrier to entry has collapsed. SMBs in Austin, Houston, Silicon Valley, and the UK now have access to business intelligence tools that were previously reserved for enterprise organizations with six-figure analytics budgets.
Why Most Small Businesses Are Sitting on Unused Gold?
The average SMB generates meaningful data from at least five sources simultaneously: CRM interactions, website behavior, financial transactions, marketing campaign performance, and customer support tickets. The problem isn't data scarcity—it's data fragmentation. When these sources exist in silos, decision-makers are forced to rely on intuition rather than evidence, which is precisely where costly mistakes get made.
Predictive analytics platforms and business intelligence dashboards now consolidate these sources into unified views that non-technical founders and operations managers can operate without it?
The Four Types of Analytics Every Business Needs
Most SMBs start at descriptive analytics and never get further. The real competitive edge comes from predictive models, knowing which leads are most likely to convert, which customers are about to churn, and which products will see demand spikes before they happen. That gap between reactive and predictive is where revenue is won or lost.
CLICK HERE TO START BUILDING NOW!
Building Your First Analytics Infrastructure: A Practical Roadmap
You don't need a data warehouse on day one. What you need is clarity on which questions you're trying to answer, then work backward to the data and tools required. Here's a phased approach that works for businesses at the $500K–$5M revenue stage:
Phase 1: Data Consolidation (Weeks 1–4)
Connect your CRM, marketing platform, and financial software to a central dashboard.
Identify your three most important business KPIs (e.g., CAC, LTV, conversion rate).
Set up automated weekly reporting so leadership isn't chasing data manually.
Clean historical data—"garbage in, garbage out" is the first rule of analytics.
Phase 2: Pattern Recognition (Weeks 5–10)
Build cohort analysis for customer acquisition by channel and time period.
Identify your highest-value customer segment by revenue contribution and retention.
Map the customer journey from first touch to close, and find the drop-off points.
Create a lead scoring model based on behavioral and demographical signals.
Phase 3: Predictive Deployment (Weeks 11–20)
Implement churn prediction models to flag at-risk accounts 30–60 days before
Deploy revenue forecasting dashboards tied to pipeline stage and historical close rates.
Automate alerts when KPIs deviate from expected ranges (anomaly detection).
Connect analytics outputs directly to automation triggers in your CRM.
CLICK HERE TO START BUILDING NOW!
Real-World Impact: What Data Analytics Delivers for Service Businesses
For agencies, consultancies, and service businesses—the core Nervea client profile, data analytics typically delivers measurable impact in three areas:
Common Analytics Mistakes That Kill Business Intelligence Projects
Analytics projects fail most often not because of bad data or wrong tools, but because of misaligned expectations between technical implementers and business stakeholders. The most common traps:
Building beautiful dashboards that nobody looks at.
Tracking vanity metrics.
Failing to establish data ownership.
Treating analytics as a one-time project rather than an ongoing operational capability.
CLICK HERE TO START BUILDING NOW!
AI-Augmented Analytics: The 2026 Differentiator
The newest frontier in business analytics is natural language querying—asking your data dashboard a question in plain English and getting an accurate, contextual answer. Tools like Microsoft Copilot for Power BI, Salesforce Einstein, and Google's Gemini integration for Looker allow non-technical users to run complex queries without SQL knowledge.
For UK and US SMBs, this removes the last meaningful barrier to data-driven decision making. When your operations manager asks "Which clients had declining engagement last quarter and what was their average invoice size?" and get an instant, accurate answer—that's when analytics shifts from a reporting function to a strategic one.
Key Takeaway: Data analytics isn't about having more data—it's about asking better questions of the data you already have. Start with three KPIs that directly reflect business health, build dashboards around them, and expand from there. The businesses that outperform their competitors in 2026 aren't the ones with the biggest data sets—they're the ones that act on insights faster.